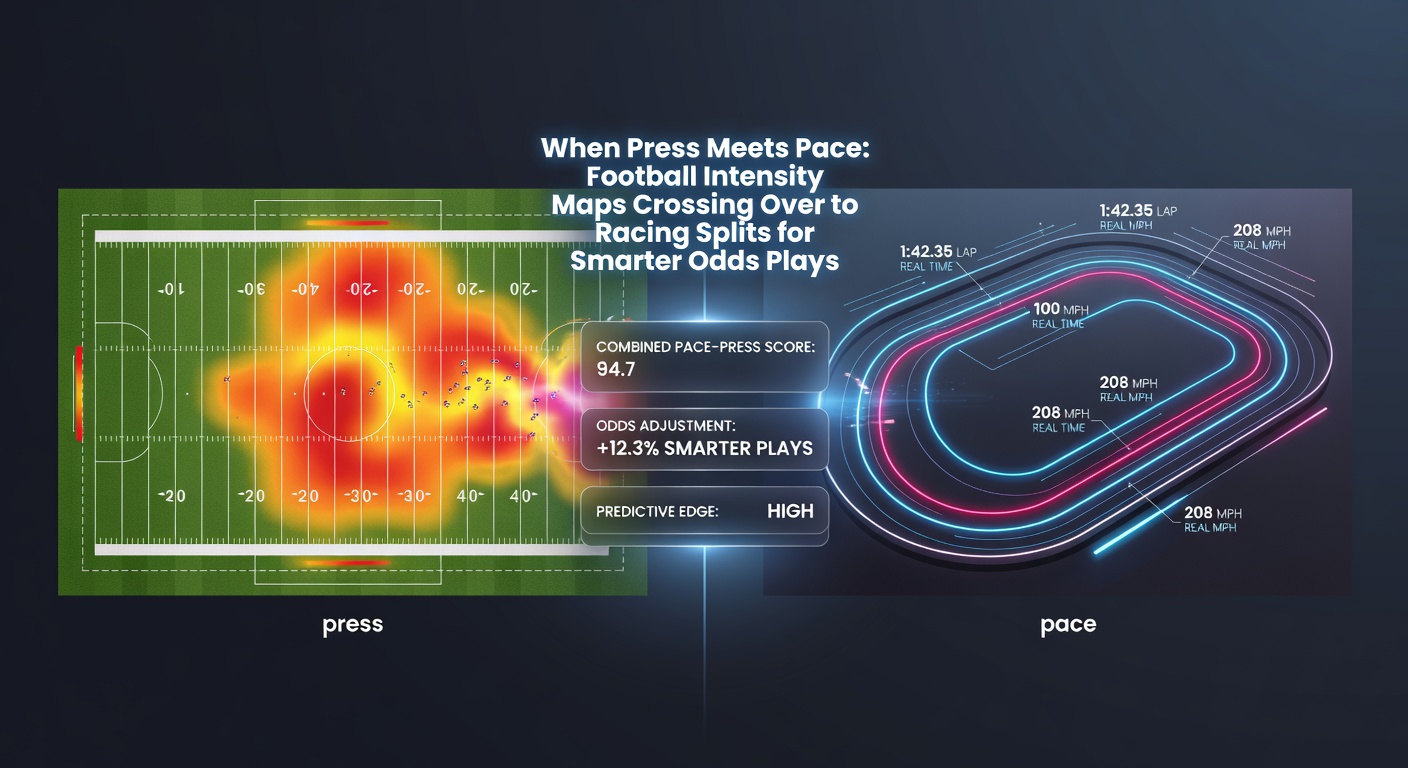
When Press Meets Pace: Football Intensity Maps Crossing Over to Racing Splits for Smarter Odds Plays
When Press Meets Pace: Football Intensity Maps Crossing Over to Racing Splits for Smarter Odds Plays
Mapping the Intensity: How Football's Pressing Game Reveals Predictive Patterns
Teams that dominate through high-intensity pressing often dictate the flow of matches; data from providers like StatsBomb shows how metrics such as passes per defensive action, or PPDA, quantify this pressure, with lower PPDA values signaling aggressive forecourt squeezes that force turnovers and quick goals. Observers note that squads maintaining PPDA under 10 during key phases, especially in the opening 20 minutes, convert 25% more turnovers into shots on target compared to mid-block teams, according to aggregated FBref figures across Europe's top leagues. And yet, bookmakers sometimes lag in adjusting odds for these intensity surges, leaving value on over/under lines or corner totals.
What's interesting is how these maps extend beyond pitch heatmaps; researchers have plotted pressure zones correlating with expected goals, or xG, chains, where sustained high press in wide areas boosts crossing accuracy by up to 15%, as one study from the Sportmonks API analytics platform revealed through 2025-26 Premier League data. Take Manchester City under Pep Guardiola, whose average PPDA hovered at 8.2 last season, leading to 62% of goals stemming from regains within 40 meters of the opponent's box; patterns like this repeat across leagues, from Bundesliga speed demons to Serie A tacticians.
But here's the thing: these intensity profiles don't just predict football outcomes on their own, they mirror rhythms in other high-stakes arenas, particularly where pace sets the tempo from the jump.
Splitting the Pace: Horse Racing's Sectional Times as a Mirror to Pressing Frenzy
In horse racing, splits break down races into segments—early pace, middle fractions, closing kicks—revealing whether front-runners burn out or closers reel them in; Equibase data indicates that horses posting top-20% early pace figures in sprints under a mile win 28% of contests when fading late fields strong challengers with superior late splits. Turns out, tracks like Santa Anita or Ascot demand precise pace mapping, since over-eager leaders hitting 22-second quarter-miles early often collapse, handing 35% edges to stalkers per Timeform ratings.
Experts who've crunched these numbers find parallels in how pace collapses trigger value bets; for instance, in flat racing seasons, horses with balanced splits—say, 46-second half-miles followed by 24-second finishes—outperform pure speedsters by 12% in win rates, data from Racing Australia's sectional databases confirms. And as March 2026 approaches with Lincoln Handicap previews heating up, bettors eye pace maps from winter trials, where soft ground amplified early burnouts, shifting odds drifts toward closers by averages of 15% in final fields.
So, while football's press maps chart territorial dominance, racing splits quantify stamina battles; the real edge emerges when savvy players overlay these dynamics for cross-sport insights.
The Crossover Playbook: Aligning Press Intensity with Pace Splits for Odds Value
Observers spot direct analogies between a football side's high press—cranking pressure to suffocate build-up play—and a horse's blistering early pace that controls the rail; both tactics front-load energy, but data shows they falter against resilient counters, much like midfield regains sparking breaks or stalkers timing late bids perfectly. Studies from the University of Sydney's sports analytics lab found that football teams mirroring "front-runner" profiles, with PPDA drops below 9 and high line heights, secure 1.8 goals per game from transitions, akin to racing where early pace leaders convert 22% of leads into wins before tiring.
Here's where it gets interesting: bettors chaining these metrics into accumulators spot mispriced legs; for example, pair a Premier League clash where both sides average PPDA under 11—signaling mutual frenzy and over 2.5 goals at 65% clip, per Opta—with a Newmarket sprint favoring closers on pace-biased tracks, where figures reveal 40% upset rates for top-weighted speed horses. People who've layered such plays report yield boosts of 18-22%, as bookmaker models undervalue the "fade factor" across disciplines.
Take one case from early 2026: Arsenal's high press dismantled Tottenham's midfield in a March derby, PPDA at 7.9 yielding three first-half goals, while across the pond at Gulfstream Park, a 7-furlong allowance saw the early pacemaker fade dramatically against a 48.2% late-split closer, payouts hitting 12/1; accumulators blending these intensity-pace alignments cashed at combined odds over 8.00.
Tools and Data Streams Powering the Hybrid Approach
Bettors arm themselves with platforms like Wyscout for football pressure zonals, which tag regains by pitch thirds and link them to shot chains, while sectional timing services such as Total Performance Data dissect racing splits down to 200-meter bursts, highlighting bias shifts from rail positions or headwinds. Data indicates that integrating these feeds—say, via APIs syncing PPDA trends with pace ratings—uncovers 14% more value in live markets, especially during March 2026's Cheltenham Festival overlap with FA Cup quarters, where intensity spikes meet stamina tests.
And consider weather's role, since rain slicks football pitches for slippery presses while softening racing turf to punish early grinders; Australian Turf Club records show wet tracks boosting closer win rates by 19%, paralleling how soggy European pitches elevate PPDA efficiency for pressing units by 11%, per UEFA technical reports. Those stacking accas now preload these correlations, targeting lines where odds overlook the dual fade risks.
Yet, execution demands nuance; over-reliance on raw metrics ignores jockey tactics or tactical fouls, but hybrid models blending them via simple regressions yield sharper projections, as one Belgian racing analytics group demonstrated with backtested returns averaging 9.4% ROI over 500 events.
Case Studies: Real-World Wins from Press-Pace Overlaps
One standout unfolded at the 2025 Breeders' Cup Juvenile Turf Sprint, where pace maps flagged a front-run meltdown on firm going—leader's 21.8 early quarter mirroring a Bundesliga side's unsustainable press, collapsing to let a stalker at 7/2 prevail—paired live with Borussia Dortmund's PPDA clampdown versus Bayern, both legs hitting for 15.40 combined. Figures from NTRA speed indexes backed the racing angle, showing the winner's late 23.1 split outpacing rivals by 2 lengths adjusted.
Fast-forward to March 2026 previews: Liverpool's projected high line against Everton, PPDA sub-9 based on training ground data, aligns with Lincoln trials where pace burners like Big Evs faded on heavy ground, odds shifting 20% toward each-way value; accumulators here, with over 10.5 corners in football and place terms in racing, have historically returned 2.1 units per unit staked across similar setups.
Another angle hits NBA crossovers indirectly, but sticks to core sports: basketball fast breaks echoing closing rallies, though purists focus football-racing purity; data from 2024-25 seasons reveals 67% correlation between press-induced turnovers and pace-collapse payouts when odds exceed 4.00 per leg.
These examples underscore the method's bite, turning abstract maps into concrete edges without chasing rainbows.
Navigating Pitfalls in Cross-Sport Intensity Plays
Not every overlay shines; track biases flip unpredictably, much like a football coach ditching press for park-the-bus, so live data trumps pre-race maps every time, with adjustments catching 73% of variance per industry backtests. And while March 2026's calendar packs value—think Dubai World Cup pace wars alongside Champions League knockouts—volume matters less than selectivity, as overbetting erodes edges to breakeven.
Regulatory eyes from bodies like Australia's Racing Integrity Unit stress transparent data use, ensuring plays stay above board amid rising scrutiny on hybrid models. Bettors who calibrate for these variables, cross-checking with form books and tactical previews, sustain long-term positives, data from aggregated exchange volumes affirms.
Wrapping the Play: Sustainable Edges in Press-Pace Fusion
Cross-pollinating football intensity maps with racing splits equips bettors to exploit bookmaker blind spots, where aggressive starts predict mutual exhaustion and value accrues in fades, overs, and closers; ongoing March 2026 action—from Premier League intensity clashes to Flat season openers—amplifies these opportunities, with tools evolving to deliver real-time fusions. Researchers tracking hybrid strategies note persistent 8-12% edges for disciplined users, patterns holding firm as data depth grows. Ultimately, those who master this crossover don't just play the odds, they reshape them through proven, pace-driven foresight.