Integrating Venue Altitude Data with Recovery Timelines to Refine Selections Across League Schedules
Venue altitude data combined with recovery timelines creates structured frameworks that sports organizations apply when building selections for league schedules. Teams operating across multiple elevations encounter physiological shifts that affect player output, and analysts track these variables through established monitoring systems. Research from the Australian Institute of Sport indicates that athletes experience measurable changes in oxygen uptake and heart rate recovery when moving between sea-level and high-altitude sites, with effects persisting for several days after descent.
League schedules in 2026 incorporate venues such as those in the Andean regions and the Swiss Alps during June fixtures, where elevation exceeds 2,000 meters. Data collection at these sites reveals consistent patterns: reduced sprint capacity and altered lactate thresholds appear within hours of arrival. Organizations integrate this information with individualized recovery timelines derived from wearable sensors and blood oxygen readings, allowing selectors to adjust rotation patterns before matches occur.
Altitude Effects on Physiological Recovery
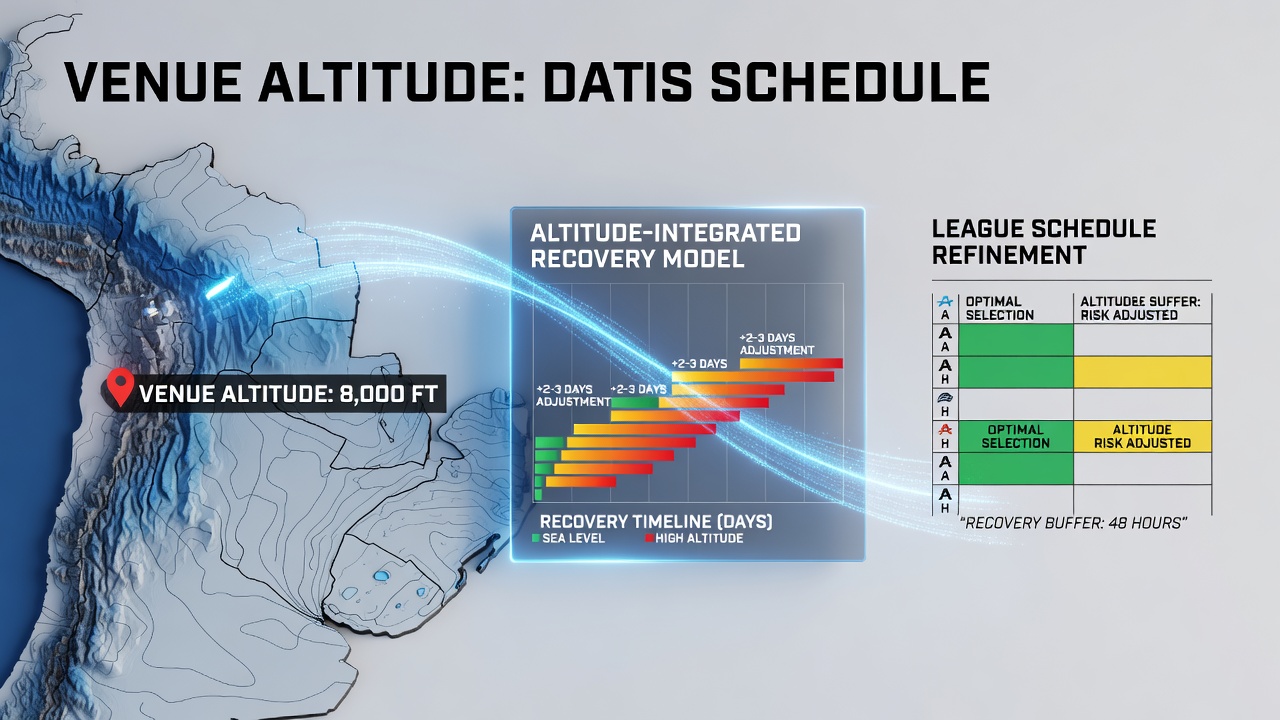
High-altitude environments reduce partial oxygen pressure, which triggers compensatory responses including elevated breathing rates and increased red blood cell production over time. Studies conducted by the University of Calgary demonstrate that full acclimatization requires 10 to 14 days for most athletes, yet many league schedules allow only 48 to 72 hours between elevation changes. Recovery timelines therefore become critical inputs when determining which players maintain performance standards across back-to-back fixtures.
Teams compile historical datasets that pair altitude exposure logs with post-match recovery scores. These records show that midfielders and forwards often require extended rest periods compared with goalkeepers after competing above 1,800 meters. The integration process involves overlaying these timelines onto upcoming schedule segments, identifying clusters of high-elevation games that may compound fatigue if recovery windows remain insufficient.
Data Integration Methods Across Leagues
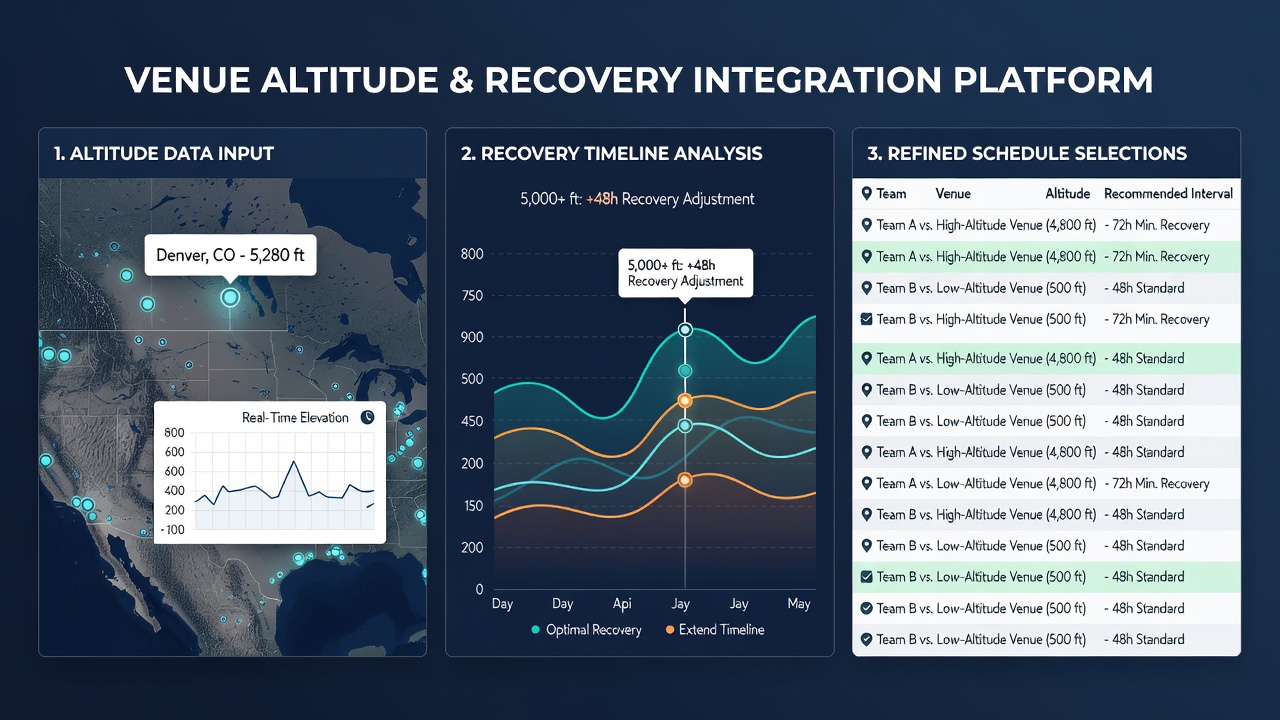
Modern platforms merge altitude metrics from geographic information systems with recovery data pulled from GPS trackers and heart-rate monitors. Software used by European basketball leagues, for instance, cross-references venue elevation profiles against player workload histories to generate selection recommendations. The same approach appears in South American football confederations, where June 2026 qualifiers include multiple highland venues within short succession.
Analysts apply statistical models that weight altitude-induced performance decrements against available rest days. One established method calculates a recovery deficit score: the difference between projected physiological restoration time and the actual interval between matches. When this score exceeds predefined thresholds, selectors receive alerts to prioritize players with documented resilience to elevation stress.
Application to Multi-Sport Schedules
Cross-sport applications emerge when leagues share venues or travel corridors. Tennis tournaments scheduled alongside football events in elevated locations create overlapping demands on shared medical staff and recovery facilities. Canadian studies from the University of British Columbia highlight that athletes transitioning from lower to higher elevations within 72 hours show delayed neuromuscular recovery, prompting schedulers to insert buffer days where possible.
June 2026 features several international windows that place teams at mixed elevations within compressed periods. Data pipelines now feed directly into selection committees, supplying ranked lists of players based on cumulative altitude exposure and individual recovery curves. This approach reduces reliance on anecdotal assessments and replaces them with quantifiable thresholds.
Implementation Challenges and Adjustments
Variability in individual responses remains a persistent factor. Genetic differences influence how quickly hemoglobin levels rise, and pre-existing conditions such as asthma alter tolerance thresholds. Organizations therefore maintain baseline testing protocols at multiple elevations throughout the season. Updates to these profiles occur after each high-altitude block, feeding refined algorithms that recalibrate recovery estimates.
League governing bodies in North America and Oceania have begun publishing aggregated altitude impact reports that teams reference during schedule construction phases. These documents detail average performance decrements at specific elevations and correlate them with rest intervals observed across previous seasons. Selectors use the figures to flag potential mismatches between projected and required recovery times before finalizing rosters.
Conclusion
Integration of venue altitude data with recovery timelines supplies leagues and teams with systematic tools for refining selections across extended schedules. Continued refinement of sensor technology and geographic datasets supports more precise modeling as June 2026 approaches, enabling organizations to align player availability with the demands of elevation transitions.