Harnessing Fatigue Signals from Thoroughbred Campaigns and Professional Leagues to Time Accumulator Entries
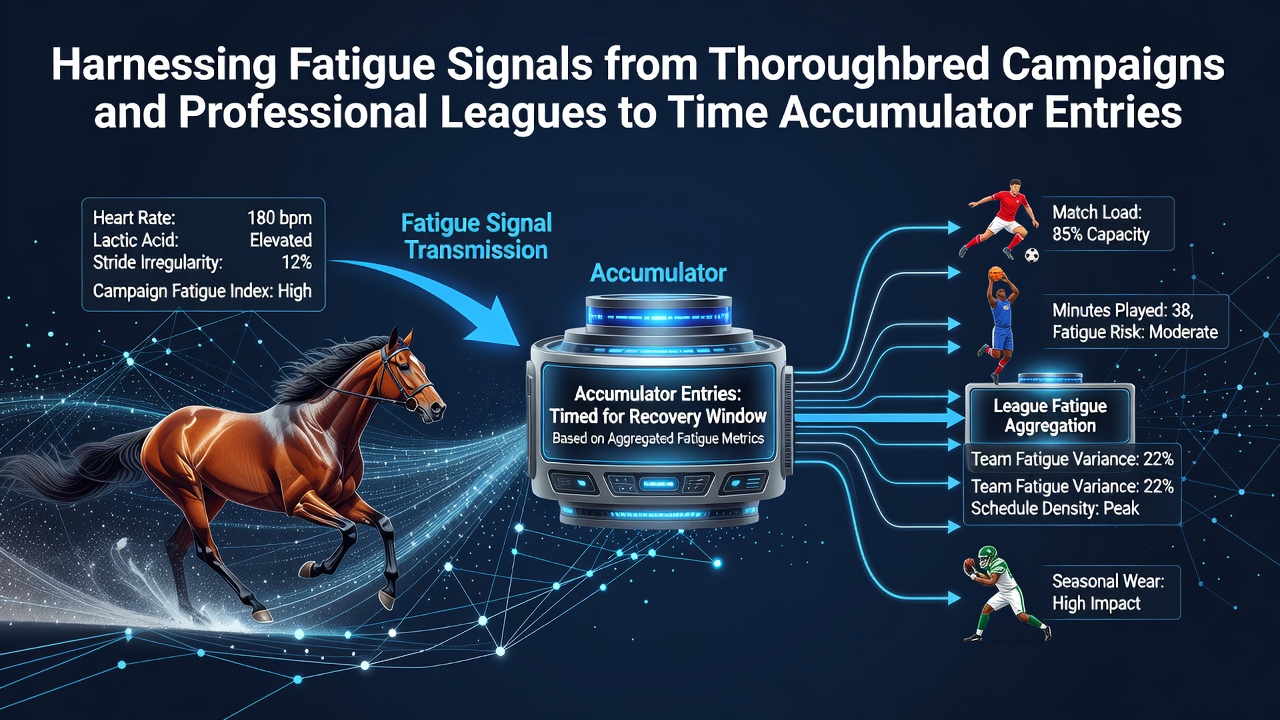
Thoroughbred racing campaigns stretch over months with horses running multiple times while professional leagues pack schedules with back-to-back fixtures and travel demands that drain players. Observers note these overlapping fatigue patterns create measurable signals that data analysts track when positioning accumulator entries across horse racing odds and league markets. Research from equine performance studies shows stride length reductions and recovery heart rate spikes often precede drops in finishing speed while league analytics reveal similar drops in sprint distance covered after congested periods.
June 2026 brings mid-season clusters in both hemispheres where flat racing festivals coincide with European football playoffs and NBA finals preparation. Those windows compress recovery times for athletes and animals alike so timing accumulator builds around these periods relies on monitoring metrics like consecutive race intervals for horses and game density for teams. Data from Australian racing authorities indicates horses with fewer than 14 days between starts show measurable declines in speed figures during longer distances while parallel NBA tracking finds teams on the second night of back-to-backs cover 5 to 8 percent less high-intensity distance.
Identifying Fatigue Markers in Thoroughbred Campaigns
Trainers and analysts record variables such as post-race lactate levels, weight loss patterns, and sectionals from previous outings to flag when a horse may underperform. One long-term study of flat racing seasons found that animals completing four or more starts within eight weeks displayed slower final furlong times on average. These patterns become actionable when cross-referenced with betting market movements because late drifts in odds often align with public recognition of the same fatigue data.
Connections between campaigns grow clearer when trainers publish stable reports or when official handicappers adjust ratings after visible effort. People who follow multiple jurisdictions watch for horses stepping up in class after hard races because those moves frequently coincide with reduced strike rates. Sectional timing systems now deliver real-time splits that highlight when early pace leaves insufficient reserves for the closing stages and that information feeds directly into accumulator construction across race cards.
Parallel Signals in Professional Leagues
Basketball and football schedules create comparable load accumulation through travel, consecutive games, and fixture congestion. League data platforms record player tracking metrics including distance per minute, acceleration counts, and recovery intervals between shifts. Teams playing three matches in seven days show elevated soft-tissue injury reports and reduced fourth-quarter output according to aggregated season-long statistics from North American and European competitions.
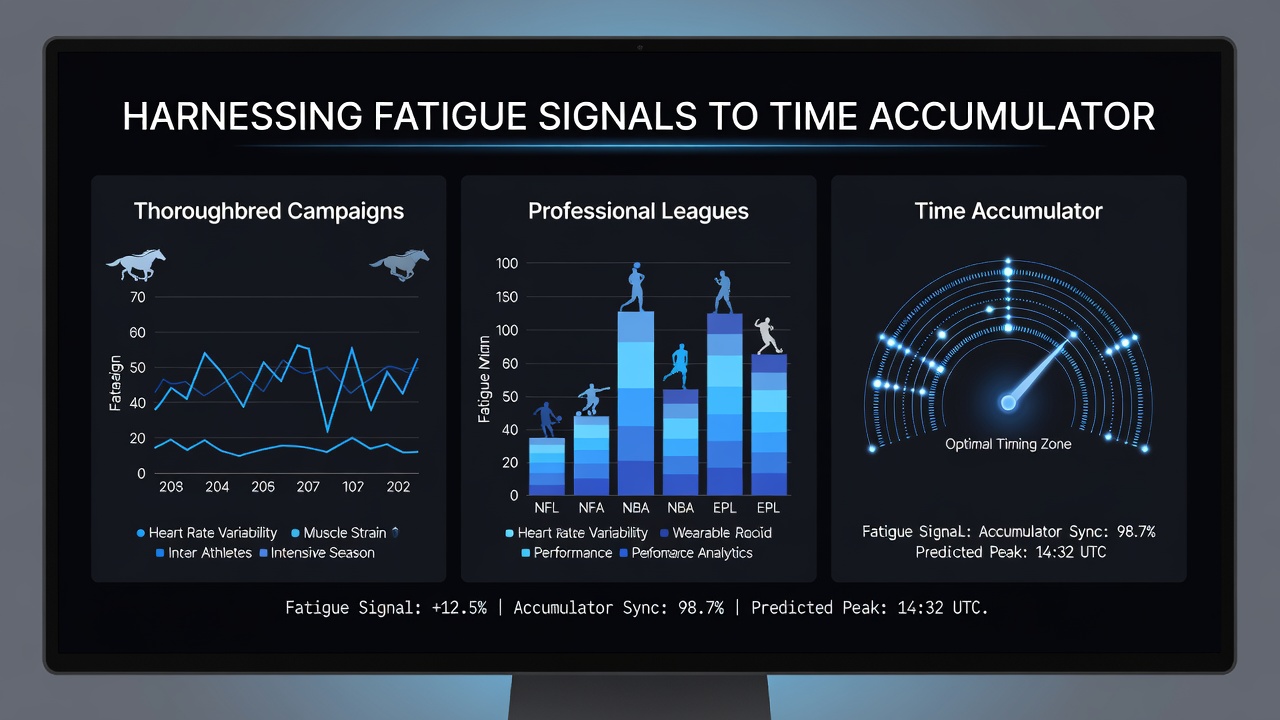
Football analysts track total distance covered and high-speed running percentages across domestic cups and league matches because spikes in fixture density correlate with drops in set-piece conversion and defensive line speed. Those who build accumulators combine these league metrics with horse racing splits to select legs where fatigue edges appear strongest. When a basketball side travels across time zones for a back-to-back while a football squad rotates key midfielders the combined probability shifts become inputs for multi-sport accumulator timing.
Integrating Cross-Sport Data for Accumulator Timing
Accumulator construction benefits when fatigue indicators from one sport validate signals in another. A horse showing declining sectional times on a Thursday card can align with a basketball team on the second leg of a back-to-back the same weekend. Analysts compile rolling averages of rest days, prior workload, adn performance decay rates then layer those figures onto betting exchanges where odds adjust gradually as information spreads.
Industry reports from the European Sports Medicine Association highlight that multi-sport data fusion improves predictive accuracy compared with single-league models because overlapping fatigue cycles amplify rather than cancel each other. Software dashboards now ingest official racing form and league GPS feeds simultaneously allowing users to flag windows where multiple selections carry elevated fatigue risk. Those windows often appear two to three days before public markets fully price the effect because specialist syndicates move earlier on proprietary tracking.
Practical Application Across June 2026 Fixtures
Flat racing meetings in June 2026 fall during international football qualifiers and NBA offseason preparation yet domestic leagues still schedule dense midweek rounds. Analysts cross-check horse recovery intervals against football squad rotation announcements released 48 hours before kickoff. When both datasets indicate elevated load the accumulator builder may delay entry until odds reflect the anticipated performance dip or may include legs on fresher participants instead.
Regulatory bodies in Australia and Canada publish periodic workload studies that feed public models while academic papers from sports science departments supply baseline equations for expected decay. Combining these sources produces timing rules such as avoiding horses with sub-21-day gaps after runs exceeding 2400 metres or steering clear of basketball totals when a team logs under 36 hours between tip-offs. The resulting accumulator sequences therefore rest on documented performance decrements rather than anecdotal observation alone.
Conclusion
Fatigue signals extracted from thoroughbred campaign histories and professional league schedules supply objective inputs for accumulator timing. Measurable declines in stride efficiency, sprint volume, and recovery metrics appear consistently across datasets from multiple jurisdictions. When these indicators align across racing and team sports the windows for positioning entries become narrower yet more precisely defined. Observers continue to refine models by incorporating new tracking technologies and official workload disclosures that emerge each season.