Fatigue Factors: Betting Smarter on NBA Teams in Back-to-Back Games
Fatigue Factors: Betting Smarter on NBA Teams in Back-to-Back Games
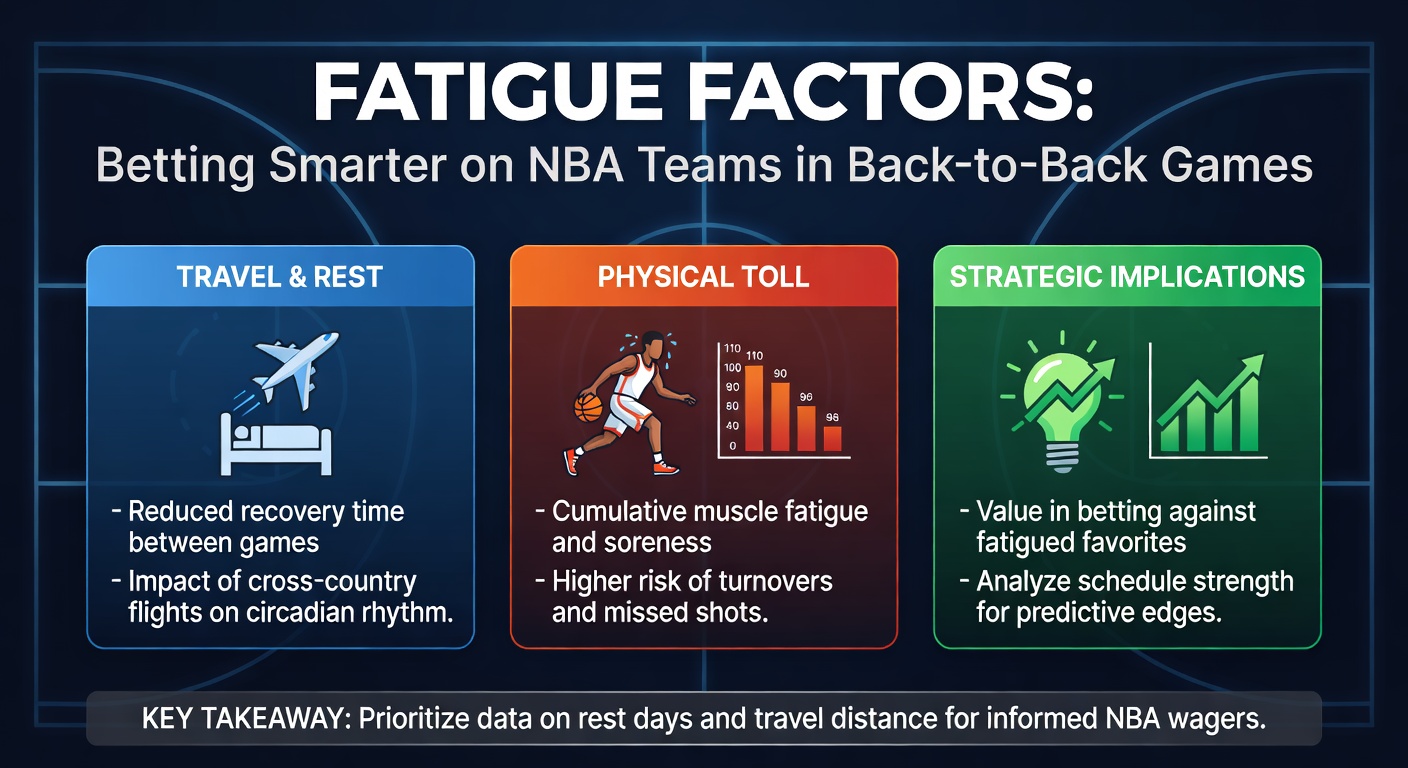
Back-to-back games pack the NBA schedule tight, especially as seasons grind on; teams face little recovery time between contests, and that setup hits performance hard. Data from multiple seasons shows these spots create clear edges for bettors who track fatigue patterns, since tired squads struggle with shooting, defense, and pace. Observers note how coaches rotate lineups differently, yet the core impact lingers; turns out, numbers don't lie when legs grow heavy after 48 minutes one night and another round looming hours later.
Decoding Back-to-Back Schedules
NBA teams log around 10 to 15 back-to-backs per regular season, with clusters hitting hardest in December through March; the league's 82-game slate demands travel too, so road warriors feel it deepest. Home teams in these sequences boast a win rate hovering near 48 percent over the last decade, while visitors drop to 42 percent, according to Basketball-Reference back-to-back splits. And here's where it gets interesting: second nights see points per game dip by 3.2 on average, rebounds fall off 1.5 per team, since bodies can't rebound fully without 48 hours rest.
Coaches adjust by leaning on bench players more, but starters still clock heavy minutes; take a typical scenario where a star logs 38 minutes Friday, then faces 42 Saturday, and efficiency craters. Travel adds another layer, particularly cross-time-zone hauls that disrupt sleep cycles; West Coast teams flying east suffer most, with win probabilities shifting 5-7 percent against them in data spanning 2015-2025.
The Physiology of Court Fatigue
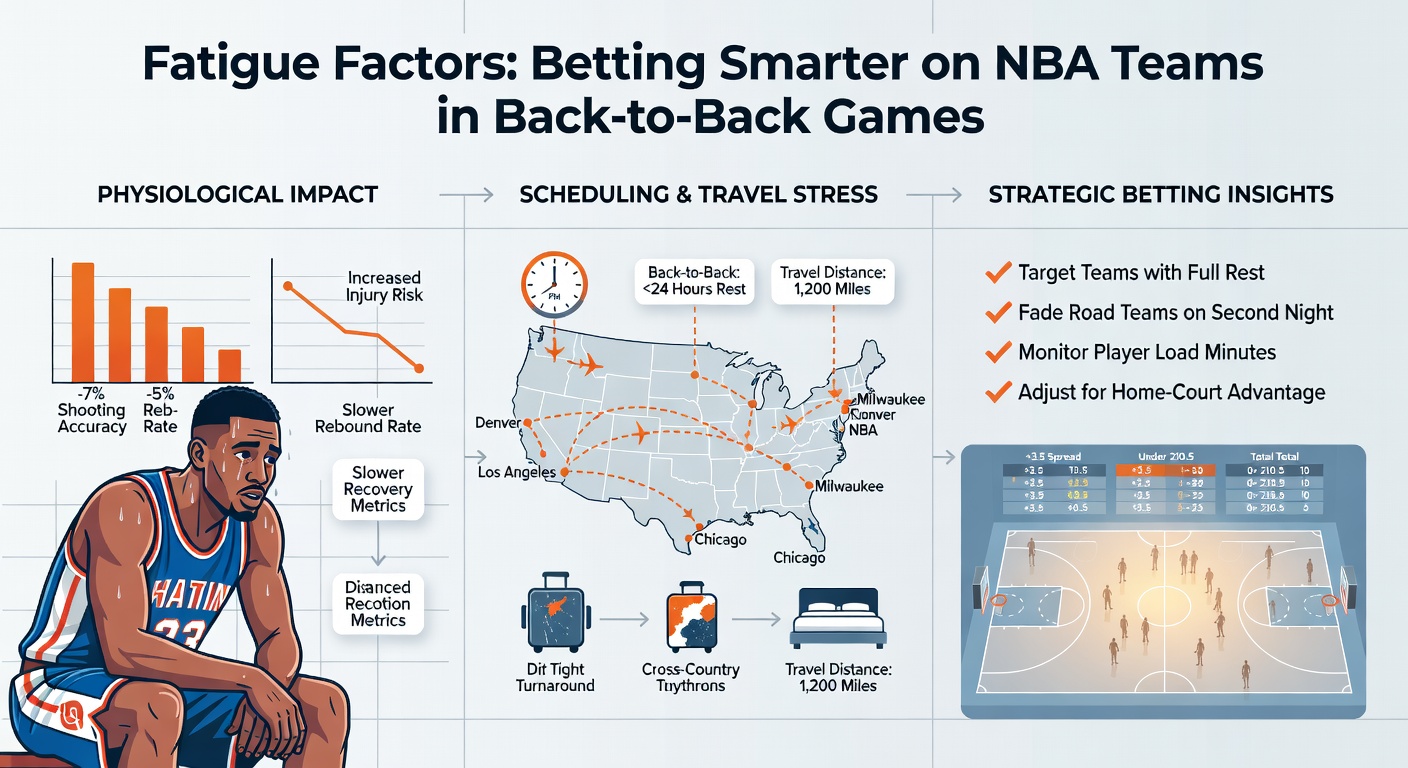
Researchers at the National Center for Biotechnology Information detail how muscle glycogen depletes faster in consecutive high-intensity efforts, leading to slower sprints and poorer jumps; NBA players burn through energy stores, and without full reload, second games show lactate buildup slowing reactions by up to 12 percent. Studies from sports science journals confirm defensive ratings worsen by 4.5 points per 100 possessions on back-to-backs, while offensive efficiency slides similarly; hydration dips too, since flights dehydrate, and that compounds everything from three-point makes to free throws.
But it's not just physical; mental fatigue creeps in, with turnover rates climbing 1.2 per game on average, as decision-making fogs under exhaustion. Experts who've tracked wearable data from players note heart rate recovery lags, signaling incomplete resets; younger rosters under 25 cope better, holding lines closer to normal, whereas veterans over 30 see steeper drops, often 8-10 percent in key metrics.
Performance Metrics That Shift
Shooting percentages tell the tale clearest; field goal rates fall 2.1 percent league-wide on second nights, threes by 3.4 percent, and that's before considering pace, which slows 1.8 possessions per game as teams grind conservatively. Rebounding margins tighten too, with back-to-back squads grabbing 1.1 fewer boards overall, yet they yield more on the offensive glass because boxes out weaken. Fouls rise 12 percent, sending opponents to the line more often; free throw makes hold steady, but attempts spike against fatigued defenses.
Turnovers spike most dramatically though, up 15 percent from rested norms, handing fast-break points freely; defensive rebounding suffers worst on the road, where teams allow 4.2 more second-chance looks per game. Pace handicaps hit run-and-gun squads hardest, like those ranking top-10 in tempo, since they can't sustain early-game bursts. Observers spot patterns in player props too: points for stars dip 2-4 per game, assists fade as vision blurs, and blocks plummet with vertical leap compromised.
Historical Trends and Standout Data
Over 10 seasons through 2025, home dogs in back-to-backs cover spreads 54 percent of the time, flipping typical vig edges; under totals hit 58 percent when both teams play consecutive nights, since scoring dries up predictably. Road favorites lose straight-up 22 percent more often than rested spots, a gap widening in April playoff pushes. Data reveals elite teams like those with top-5 nets hold serve better, winning 52 percent on second nights versus 45 percent for middling squads; injury reports amplify this, as nagging tweaks flare without rest.
One study from sports analytics firms crunched 5,000-plus games, finding effective field goal percentage drops correlate directly with hours between tip-offs; less than 24 hours means 1.8 percent worse, barely more and it's 0.9 percent off. Cross-reference with altitude games, and Denver's home edge shrinks 6 percent on back-to-backs, while sea-level foes exploit it.
Case Studies: Lessons from the Court
Take the 2023-24 Lakers, who went 4-6 in back-to-backs; LeBron James averaged 24.2 points on 46 percent shooting those nights, down from 27.1 at 50 percent rested, and their defense leaked 118 points per 100 possessions. Contrast with the rested Clippers that year, who feasted on tired foes, covering 7 of 9 such spots. Another case: 2022 Warriors faced a brutal three-in-four stretch, dropping three straight second games, with Curry's threes dipping to 28 percent from 39 percent baseline.
People who've pored over these recall the 2021 Suns' playoff run, where back-to-back simulations in regular season honed resilience, yet even they faltered 2-4 late season; bettors who faded Phoenix road B2Bs banked consistent value. Fast-forward to 2024-25, and the Celtics bucked trends at home, going 7-3 in second nights thanks to deep rotations, but road woes hit 1-5, underscoring venue's role even for contenders.
Betting Strategies Grounded in Fatigue
Bettors zero in on unders first, since 62 percent cash when road teams play consecutive games; pair that with player props under for stars' points or assists, where lines overestimate output. Fade road favorites by 3+ points in B2Bs, as they cover just 46 percent historically; live betting shines too, targeting second-half fades when quarters drag. Track rest disadvantages: teams on zero days versus two win 61 percent, so shop lines for value there.
Hybrid plays mix fatigue with matchups; rusty defenses yield overs on threes against shooters, yet totals stay low overall. Advanced bettors layer in pace-adjusted metrics, betting slow teams to dictate tempo against fatigued fast-breakers. And don't sleep on series spots: third games in mini-back-to-backs tank hardest, with win rates dipping below 40 percent for the middle team.
Spotlights from March 2026
As the 2025-26 season hits March crunch time, fatigue bites early playoff hopefuls; the Thunder, atop the West, navigate four back-to-backs already, holding 5-3 second nights but leaking 112 points per game on road legs. Knicks in the East face a brutal five-game stretch March 15-25, with data projecting 2-3 losses as Brunson logs mega-minutes. Grizzlies, meanwhile, thrive at home B2Bs (4-1 so far), covering spreads via bench surges; bettors watch travel-heavy Clippers, who've dropped three straight second nights cross-country.
League-wide, unders dominate March B2Bs at 60 percent through mid-month, while road dogs cover 56 percent; injuries compound it, like Warriors sans Curry fading badly. Observers track these closely, since playoff seeding hinges on surviving the grind.
Wrapping the Fatigue Playbook
Fatigue patterns offer bettors repeatable edges in NBA back-to-backs, from metrics showing scoring dips and defensive lapses to historical splits favoring homes and unders; strategies like fading road chalk or live second-half plays turn data into wins. As March 2026 unfolds, those digging schedules and stats stay ahead, since tired teams telegraph vulnerabilities plain as day. Numbers keep stacking, and smart plays follow suit.